Measurement of Spin-Density Matrix Elements in $\Delta^{++}(1232)$ photoproduction
Abstract:
We measure the spin-density matrix elements (SDMEs) of the $\Delta^{++}(1232)$ in the photoproduction reaction $\gamma p \to \pi^-\Delta^{++}(1232)$ with the GlueX experiment in Hall D at Jefferson Lab. The measurement uses a linearly-polarized photon beam with energies from $8.2$ to $8.8$ GeV and the statistical precision of the SDMEs exceeds the previous measurement by three orders of magnitude for the momentum transfer squared region below $1.4$ GeV$^2$. The data are sensitive to the previously undetermined relative sign between couplings in existing Regge-exchange models. Linear combinations of the extracted SDMEs allow for a decomposition into natural and unnatural-exchange amplitudes. We find that the unnatural exchange plays an important role in the low momentum transfer region.Journal: Phys.Lett.B 863 (2025) 139368
arXiv: arXiv:2406.12829
HEPdata: link
Phys.Lett.B 863 (2025) 139368: downloads png pdf |
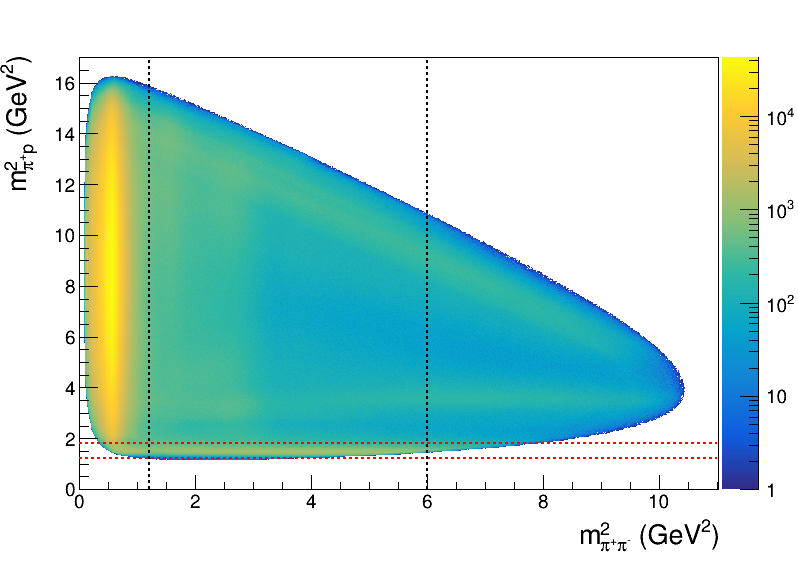
Figure 1a:
Measured Dalitz plot of the reaction $\gamma p \to \pi^-\pi^+p$. Vertical bands show contributions from the $\pi^-\pi^+$ meson system \textit{e.g.} $\rho(770)$, while horizontal bands show the $\Delta^{++}(1232)$ and excited baryon states that decay to $\pi^+p$. On the diagonal, baryon contributions from $N^*/\Delta^{0*}$ are visible in the $\pi^-p$ system. The dashed black and red lines show the chosen selections on the $\pi^-\pi^+$ and $\pi^+p$ masses, respectively. |
Phys.Lett.B 863 (2025) 139368: downloads png pdf |
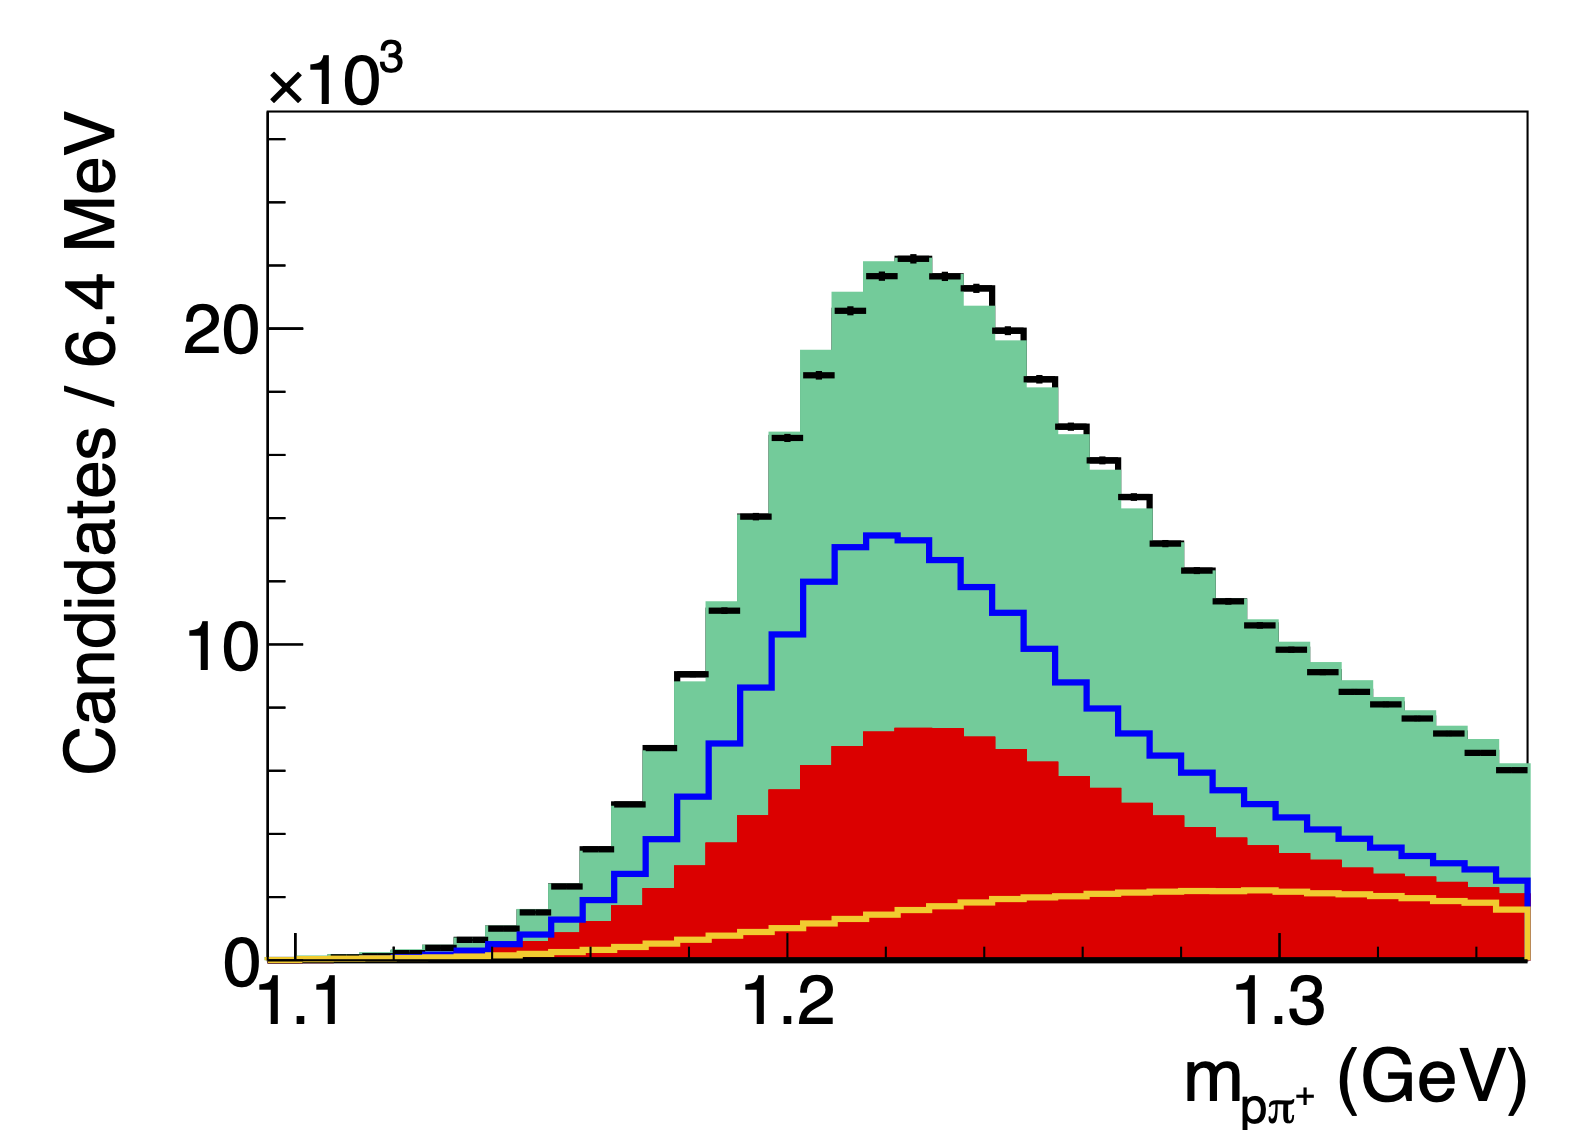
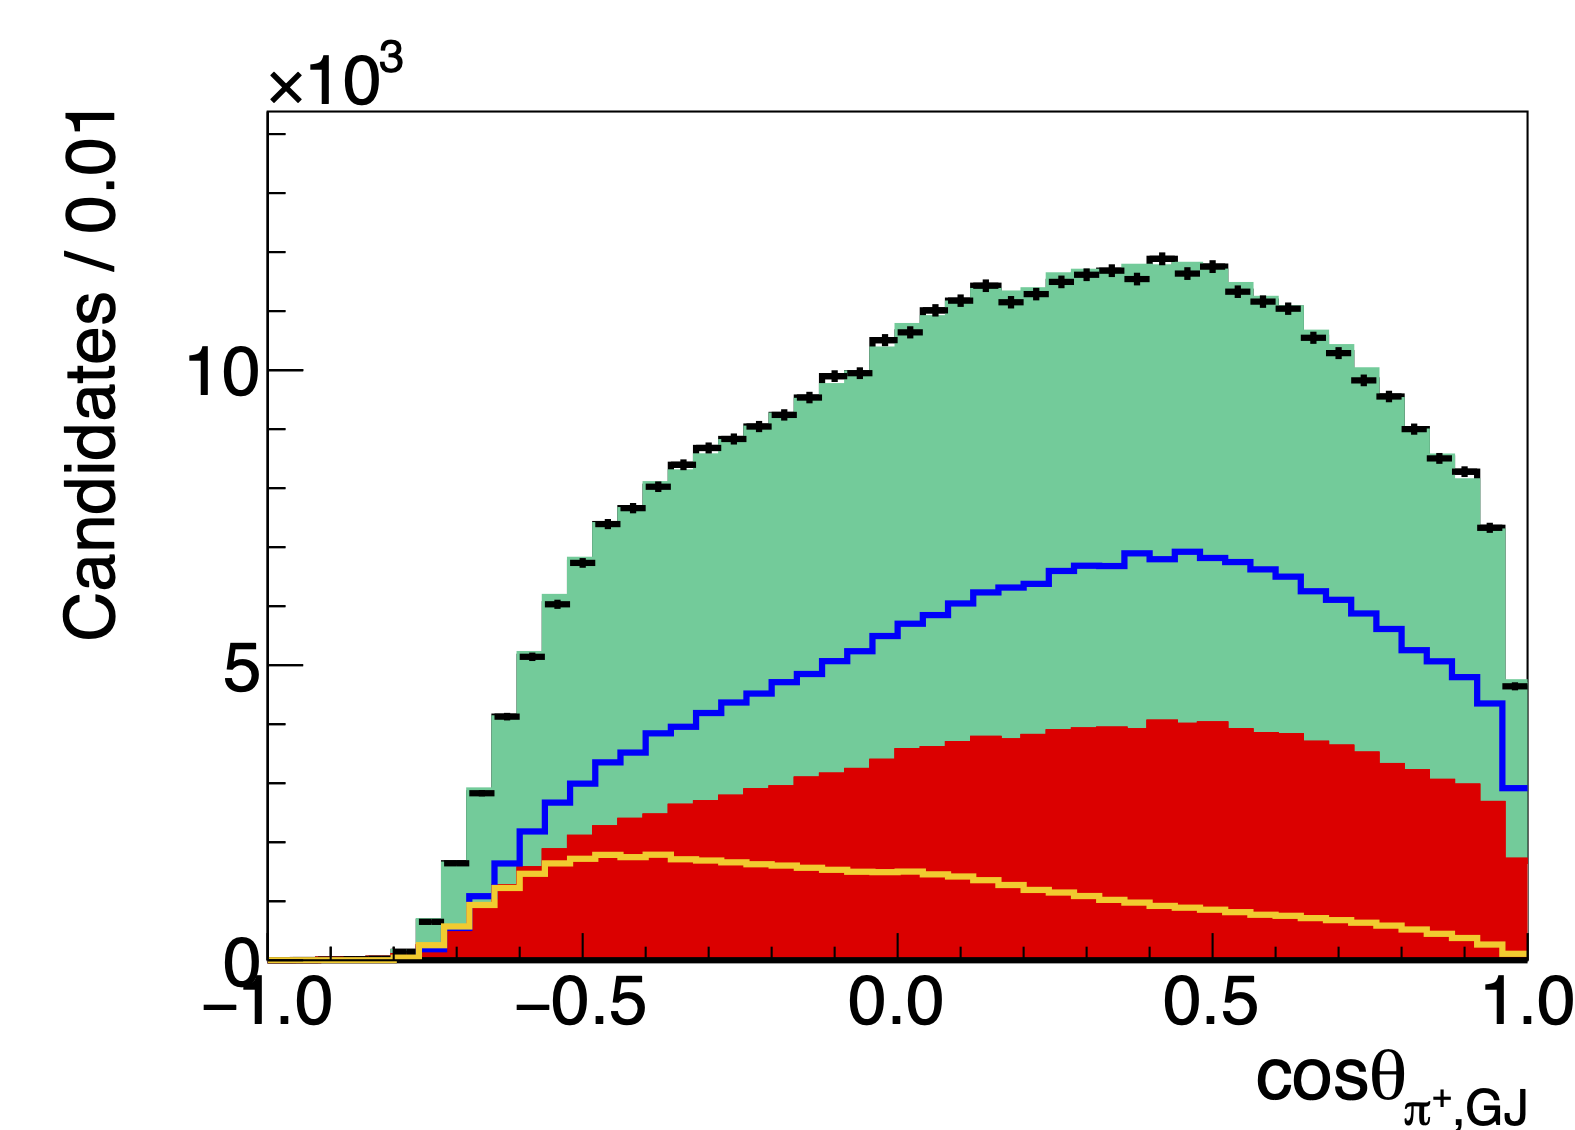
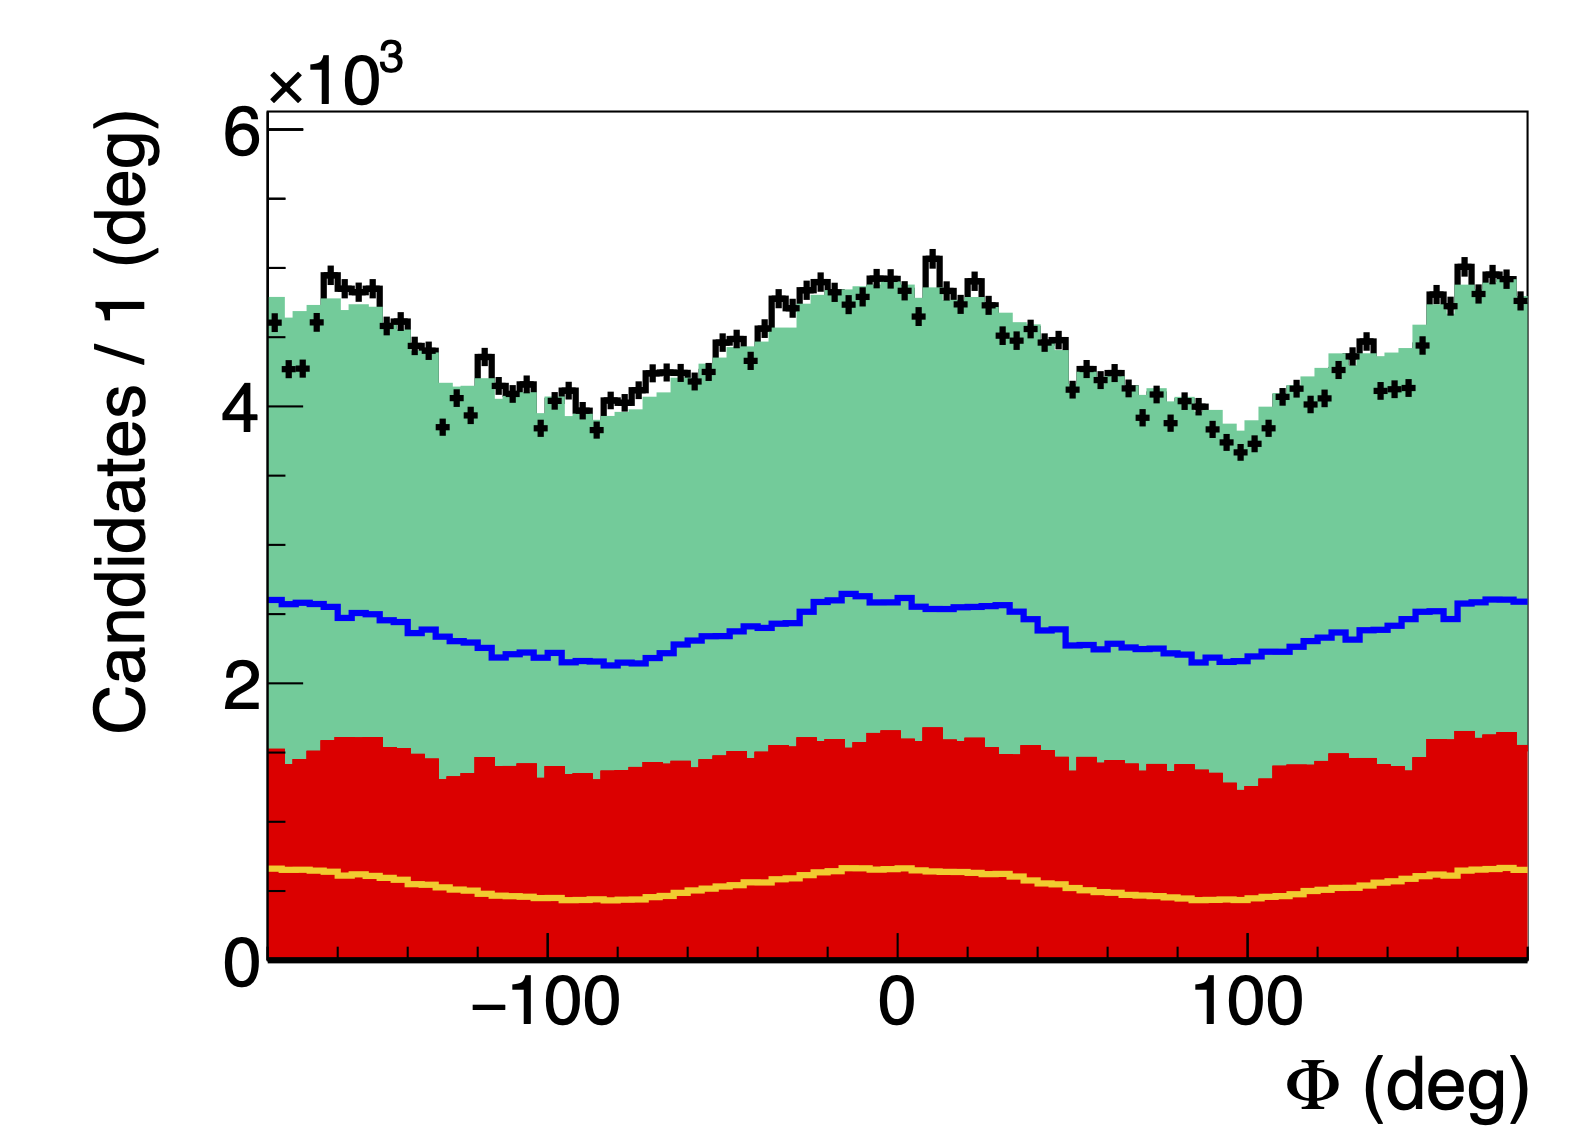
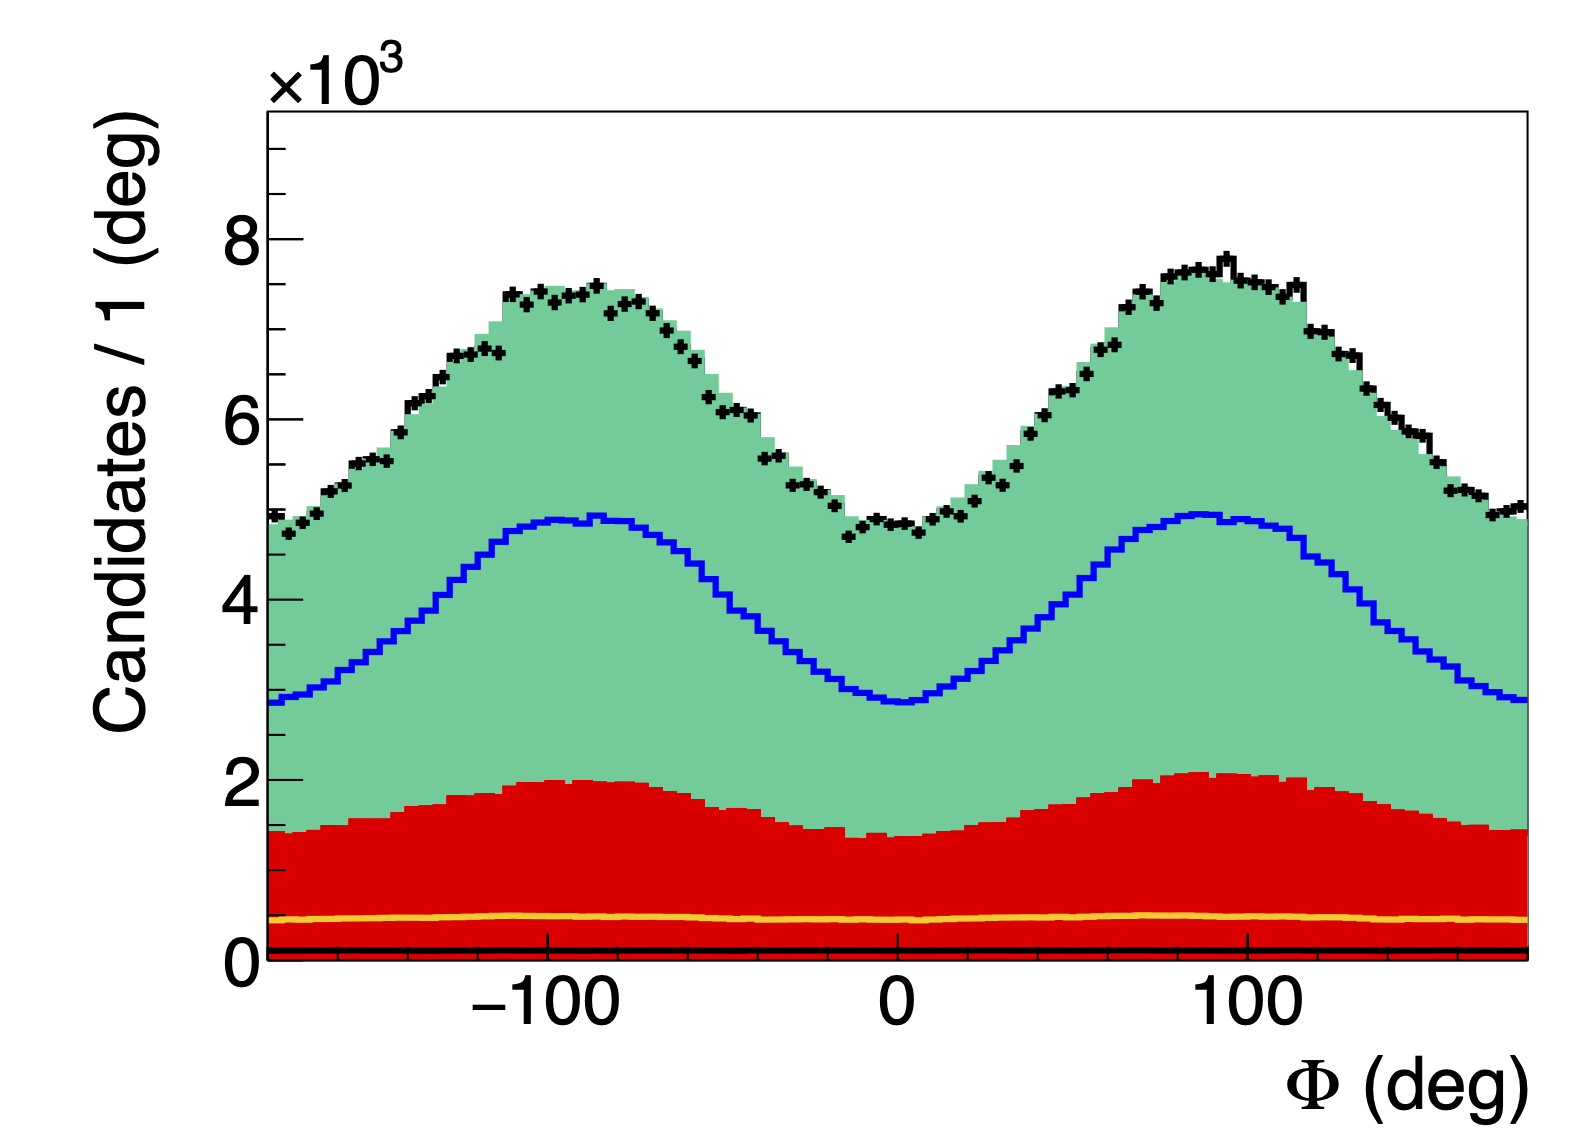
Figure 2a:
Measured distributions (black points) compared to simulated phase-space distributions weighted by the detector acceptance and the fit results (green shaded area). The accidental time background distribution is depicted as the red shaded area. The blue, yellow, and black lines show the $\pi^-\Delta^{++}$, $(\pi^-\pi^+) p$ and phase space contributions, respectively, in the fit model given by Eq. 1. The left and right columns show results for two representative $t$ bins. The phase space contribution is very small. |
Phys.Lett.B 863 (2025) 139368: downloads png pdf |
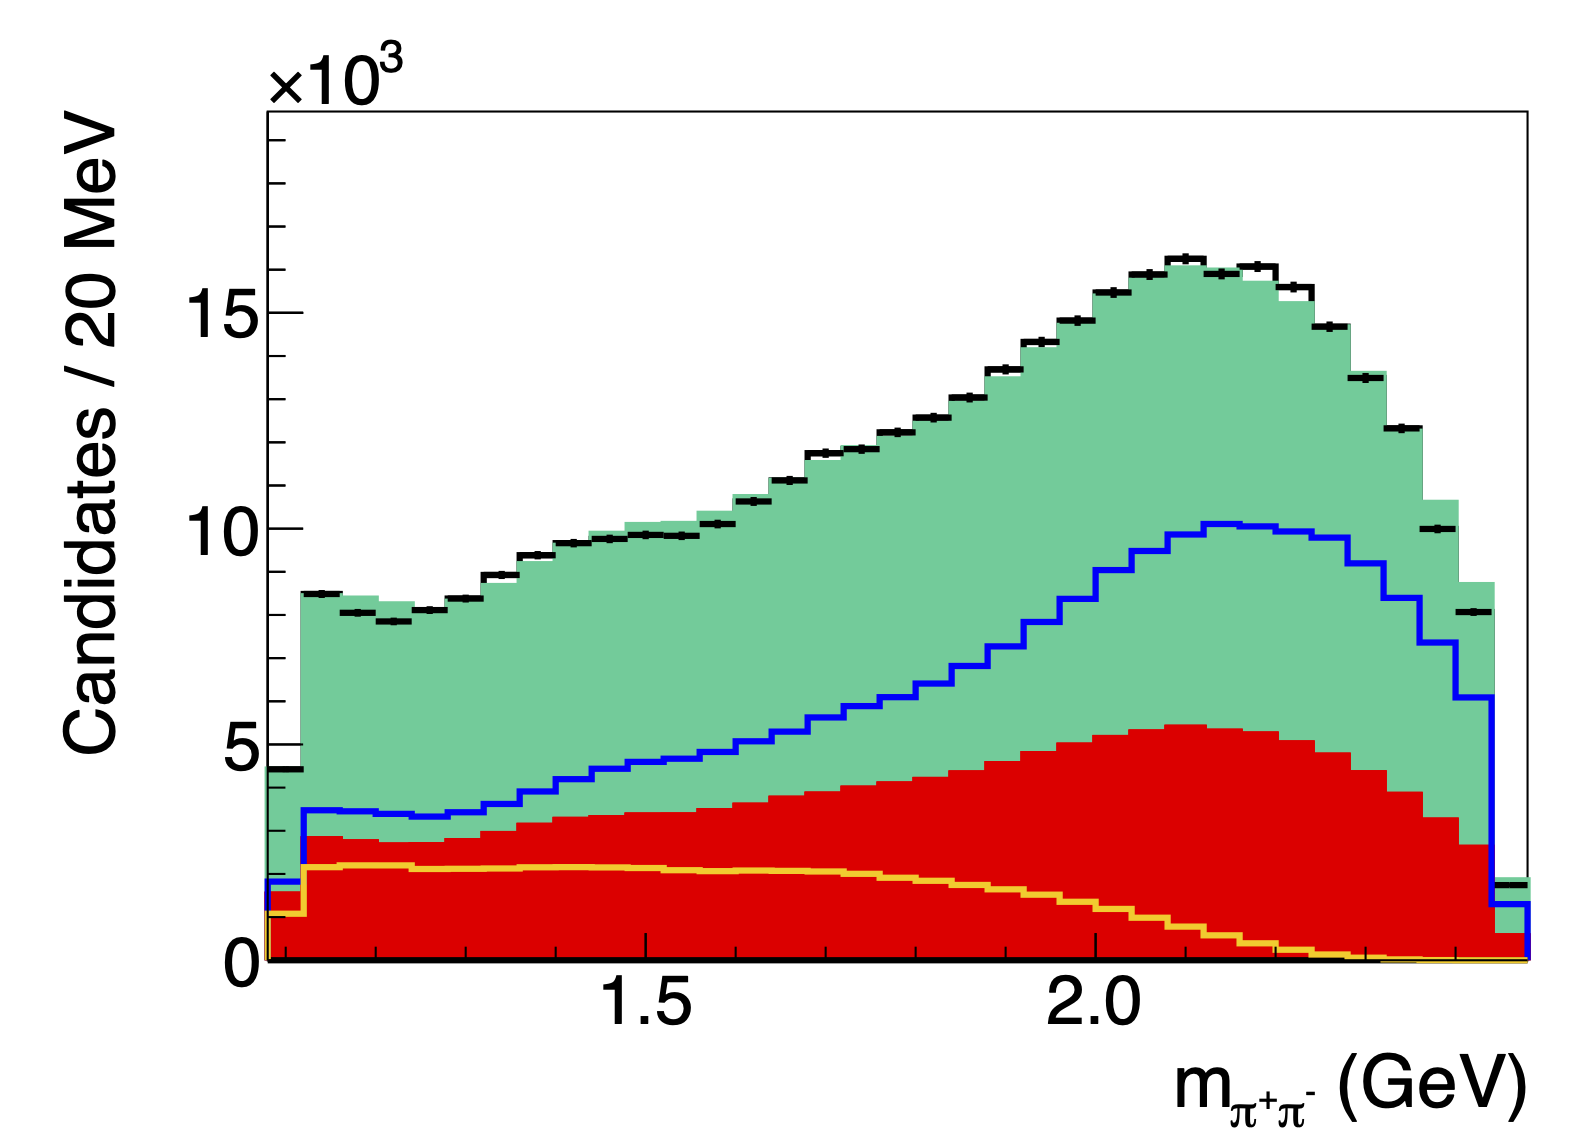
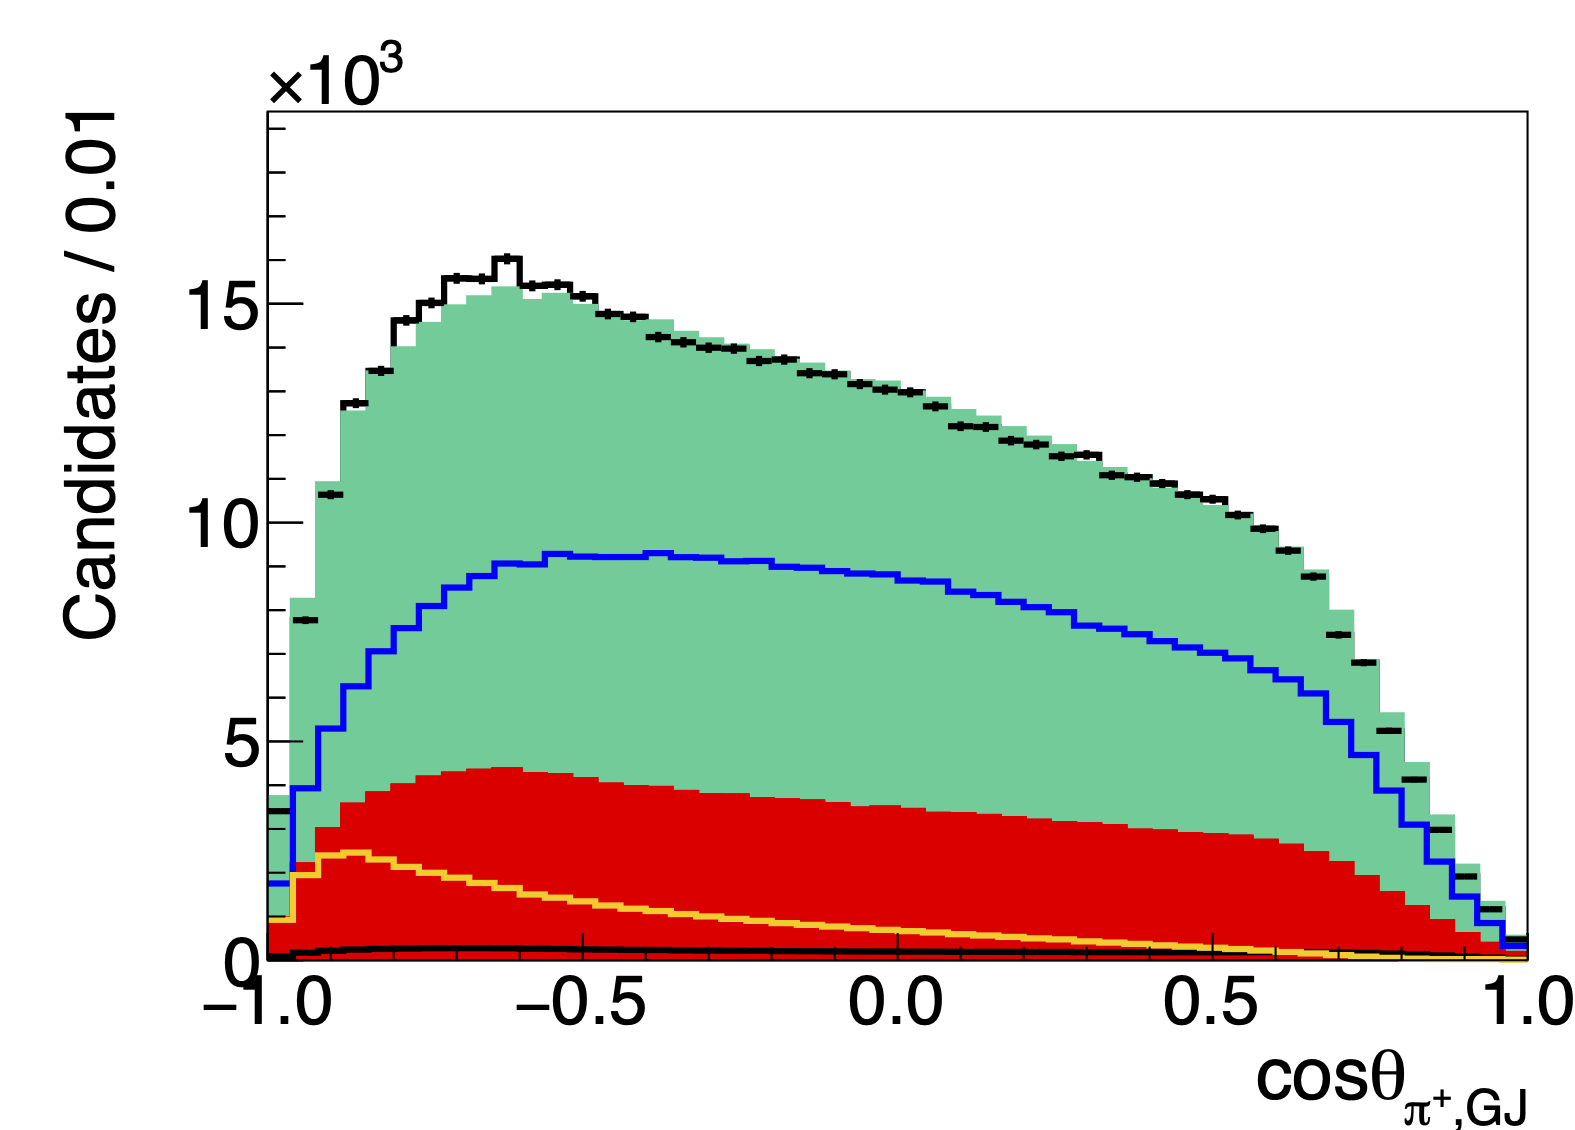
Figure 2b:
Measured distributions (black points) compared to simulated phase-space distributions weighted by the detector acceptance and the fit results (green shaded area). The accidental time background distribution is depicted as the red shaded area. The blue, yellow, and black lines show the $\pi^-\Delta^{++}$, $(\pi^-\pi^+) p$ and phase space contributions, respectively, in the fit model given by Eq. 1. The left and right columns show results for two representative $t$ bins. The phase space contribution is very small. |
Phys.Lett.B 863 (2025) 139368: downloads png pdf |
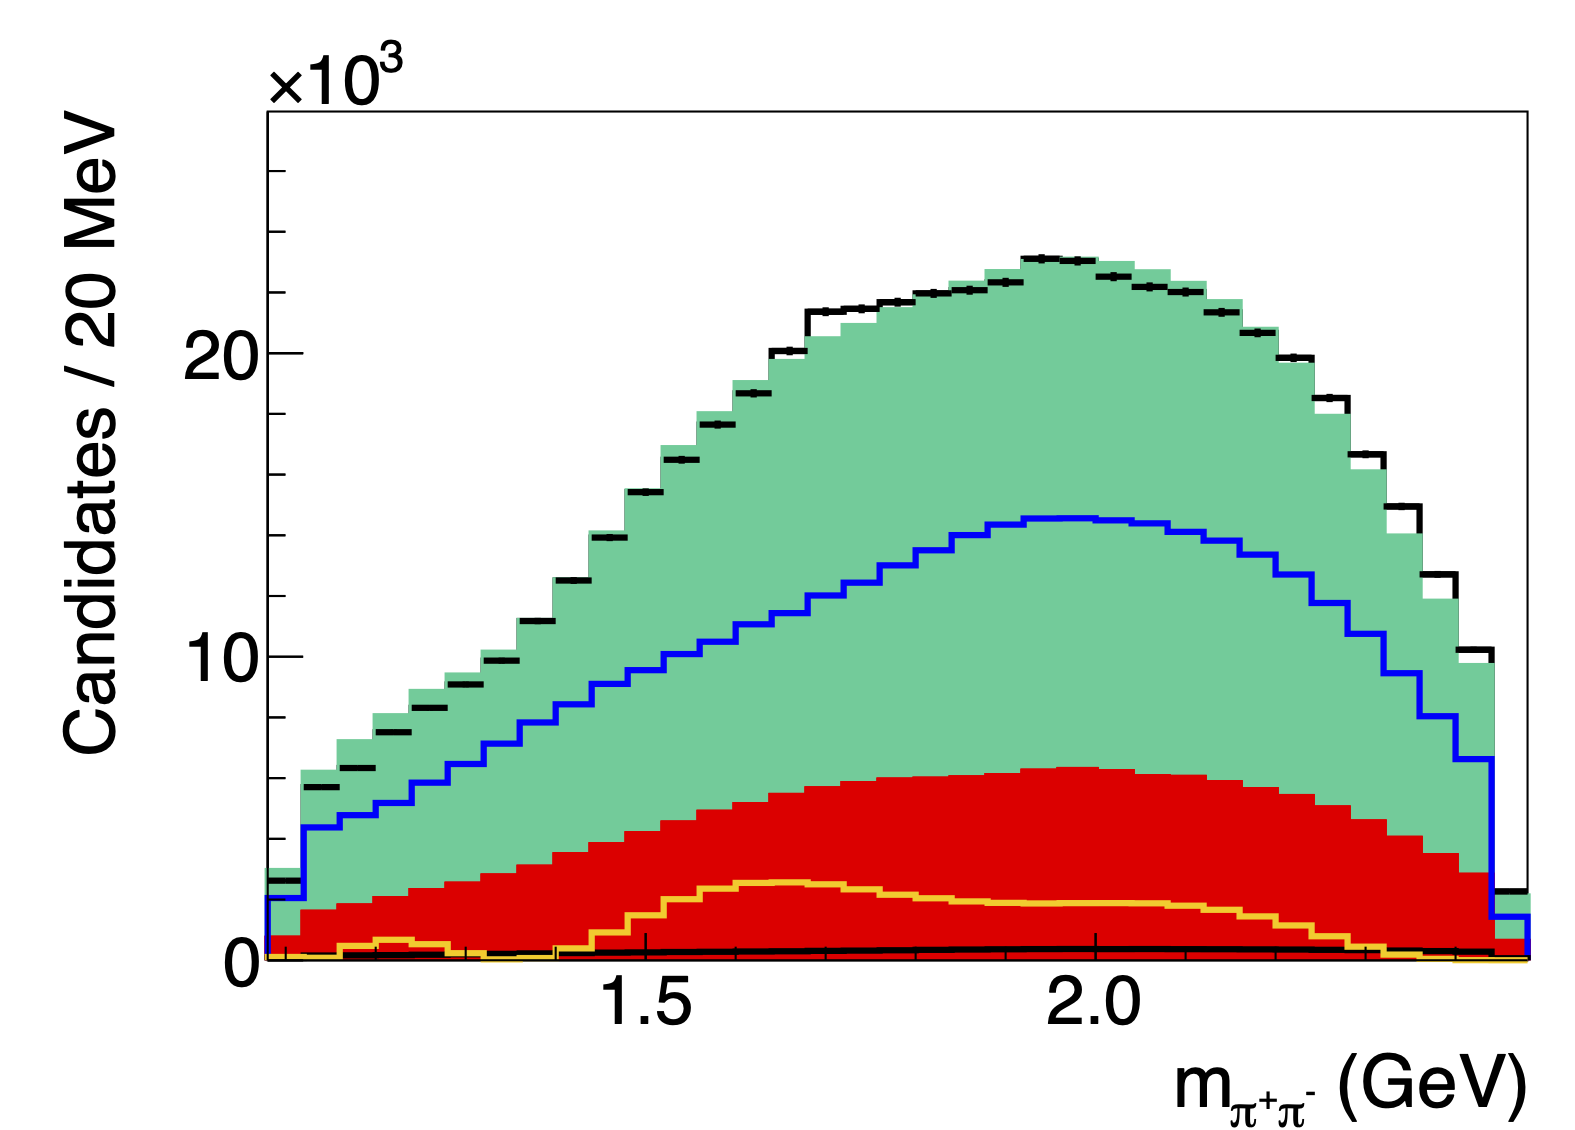
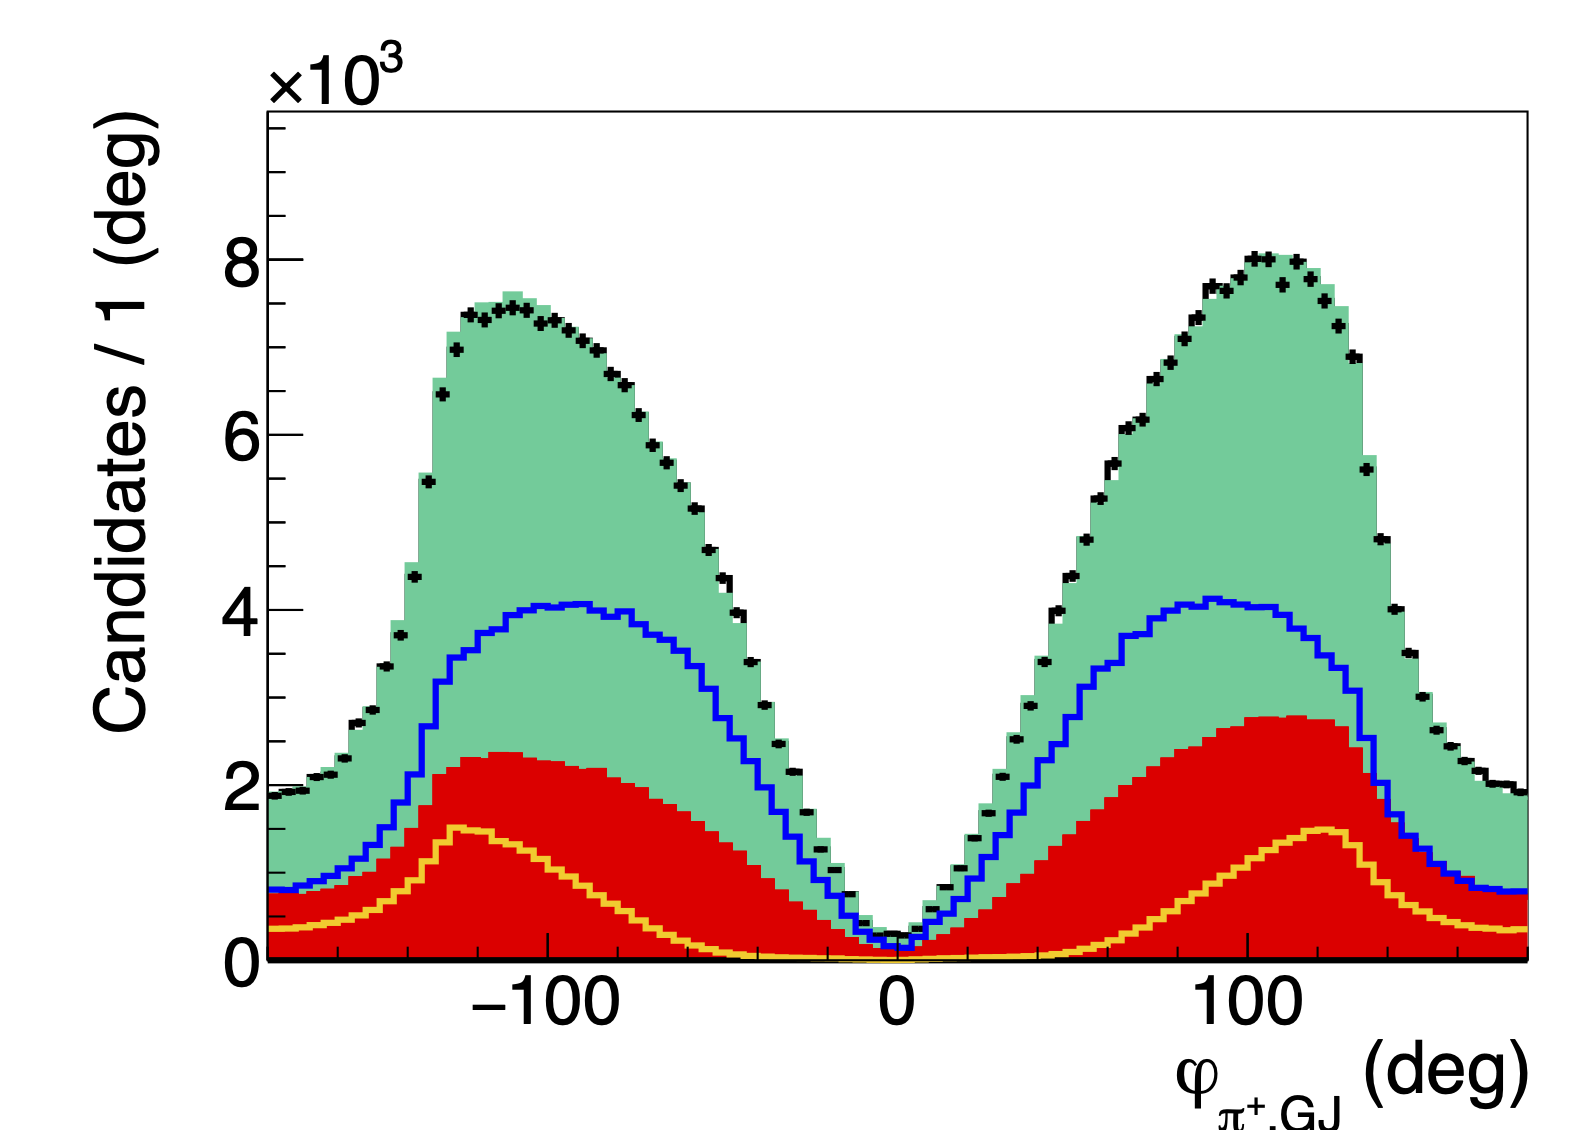
Figure 2c:
Measured distributions (black points) compared to simulated phase-space distributions weighted by the detector acceptance and the fit results (green shaded area). The accidental time background distribution is depicted as the red shaded area. The blue, yellow, and black lines show the $\pi^-\Delta^{++}$, $(\pi^-\pi^+) p$ and phase space contributions, respectively, in the fit model given by Eq. 1. The left and right columns show results for two representative $t$ bins. The phase space contribution is very small. |
Phys.Lett.B 863 (2025) 139368: downloads png pdf |
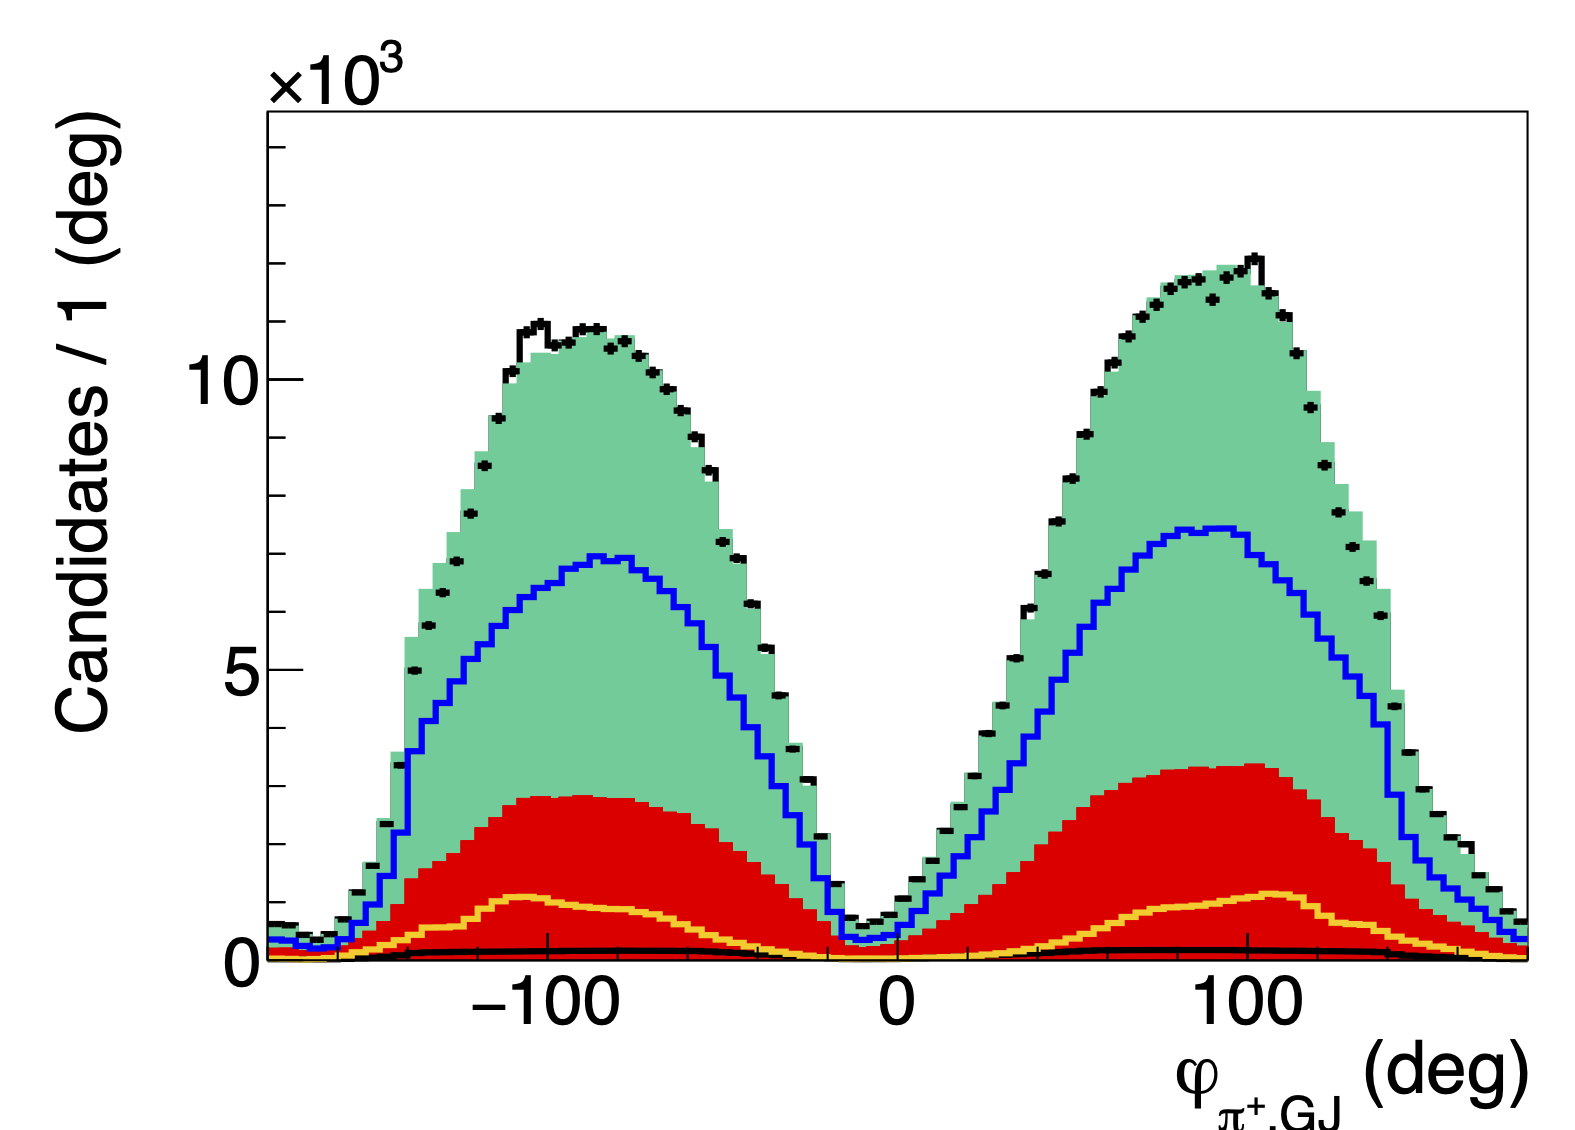
Figure 2d:
Measured distributions (black points) compared to simulated phase-space distributions weighted by the detector acceptance and the fit results (green shaded area). The accidental time background distribution is depicted as the red shaded area. The blue, yellow, and black lines show the $\pi^-\Delta^{++}$, $(\pi^-\pi^+) p$ and phase space contributions, respectively, in the fit model given by Eq. 1. The left and right columns show results for two representative $t$ bins. The phase space contribution is very small. |
Phys.Lett.B 863 (2025) 139368: downloads png pdf |
Figure 2e:
Measured distributions (black points) compared to simulated phase-space distributions weighted by the detector acceptance and the fit results (green shaded area). The accidental time background distribution is depicted as the red shaded area. The blue, yellow, and black lines show the $\pi^-\Delta^{++}$, $(\pi^-\pi^+) p$ and phase space contributions, respectively, in the fit model given by Eq. 1. The left and right columns show results for two representative $t$ bins. The phase space contribution is very small. |
Phys.Lett.B 863 (2025) 139368: downloads png pdf |
Figure 2f:
Measured distributions (black points) compared to simulated phase-space distributions weighted by the detector acceptance and the fit results (green shaded area). The accidental time background distribution is depicted as the red shaded area. The blue, yellow, and black lines show the $\pi^-\Delta^{++}$, $(\pi^-\pi^+) p$ and phase space contributions, respectively, in the fit model given by Eq. 1. The left and right columns show results for two representative $t$ bins. The phase space contribution is very small. |
Phys.Lett.B 863 (2025) 139368: downloads png pdf |
Figure 2g:
Measured distributions (black points) compared to simulated phase-space distributions weighted by the detector acceptance and the fit results (green shaded area). The accidental time background distribution is depicted as the red shaded area. The blue, yellow, and black lines show the $\pi^-\Delta^{++}$, $(\pi^-\pi^+) p$ and phase space contributions, respectively, in the fit model given by Eq. 1. The left and right columns show results for two representative $t$ bins. The phase space contribution is very small. |
Phys.Lett.B 863 (2025) 139368: downloads png pdf |
Figure 2h:
Measured distributions (black points) compared to simulated phase-space distributions weighted by the detector acceptance and the fit results (green shaded area). The accidental time background distribution is depicted as the red shaded area. The blue, yellow, and black lines show the $\pi^-\Delta^{++}$, $(\pi^-\pi^+) p$ and phase space contributions, respectively, in the fit model given by Eq. 1. The left and right columns show results for two representative $t$ bins. The phase space contribution is very small. |
Phys.Lett.B 863 (2025) 139368: downloads png pdf |
Figure 2i:
Measured distributions (black points) compared to simulated phase-space distributions weighted by the detector acceptance and the fit results (green shaded area). The accidental time background distribution is depicted as the red shaded area. The blue, yellow, and black lines show the $\pi^-\Delta^{++}$, $(\pi^-\pi^+) p$ and phase space contributions, respectively, in the fit model given by Eq. 1. The left and right columns show results for two representative $t$ bins. The phase space contribution is very small. |
Phys.Lett.B 863 (2025) 139368: downloads png pdf |
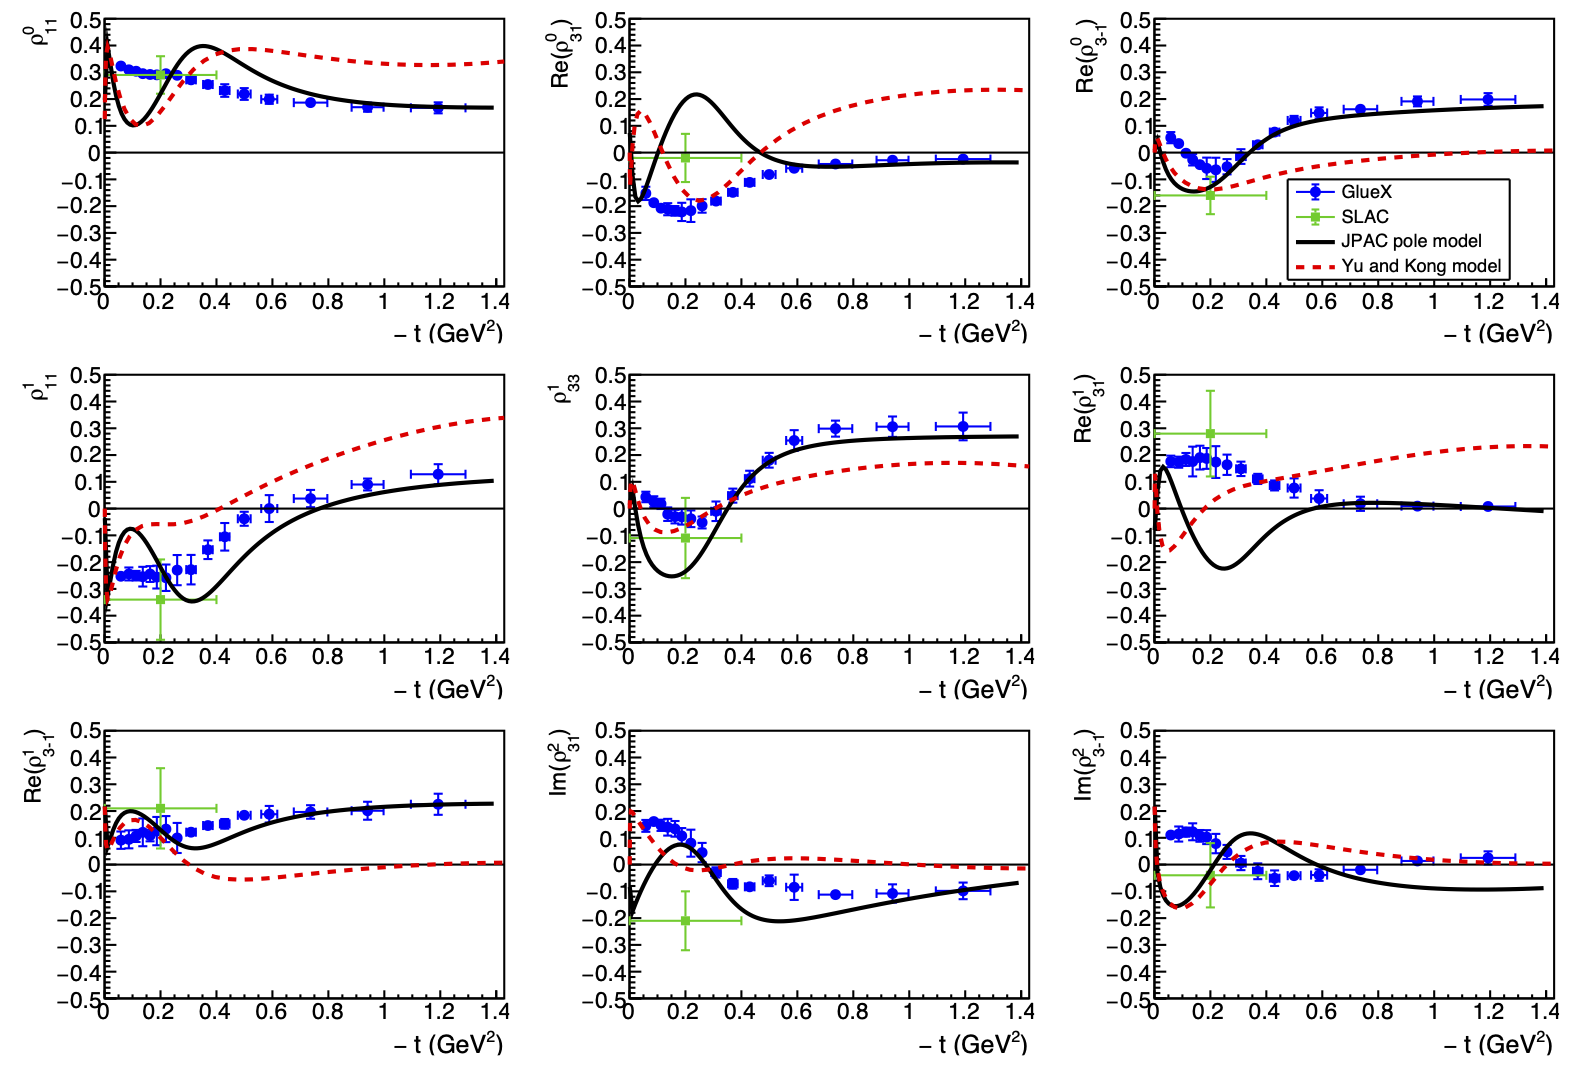
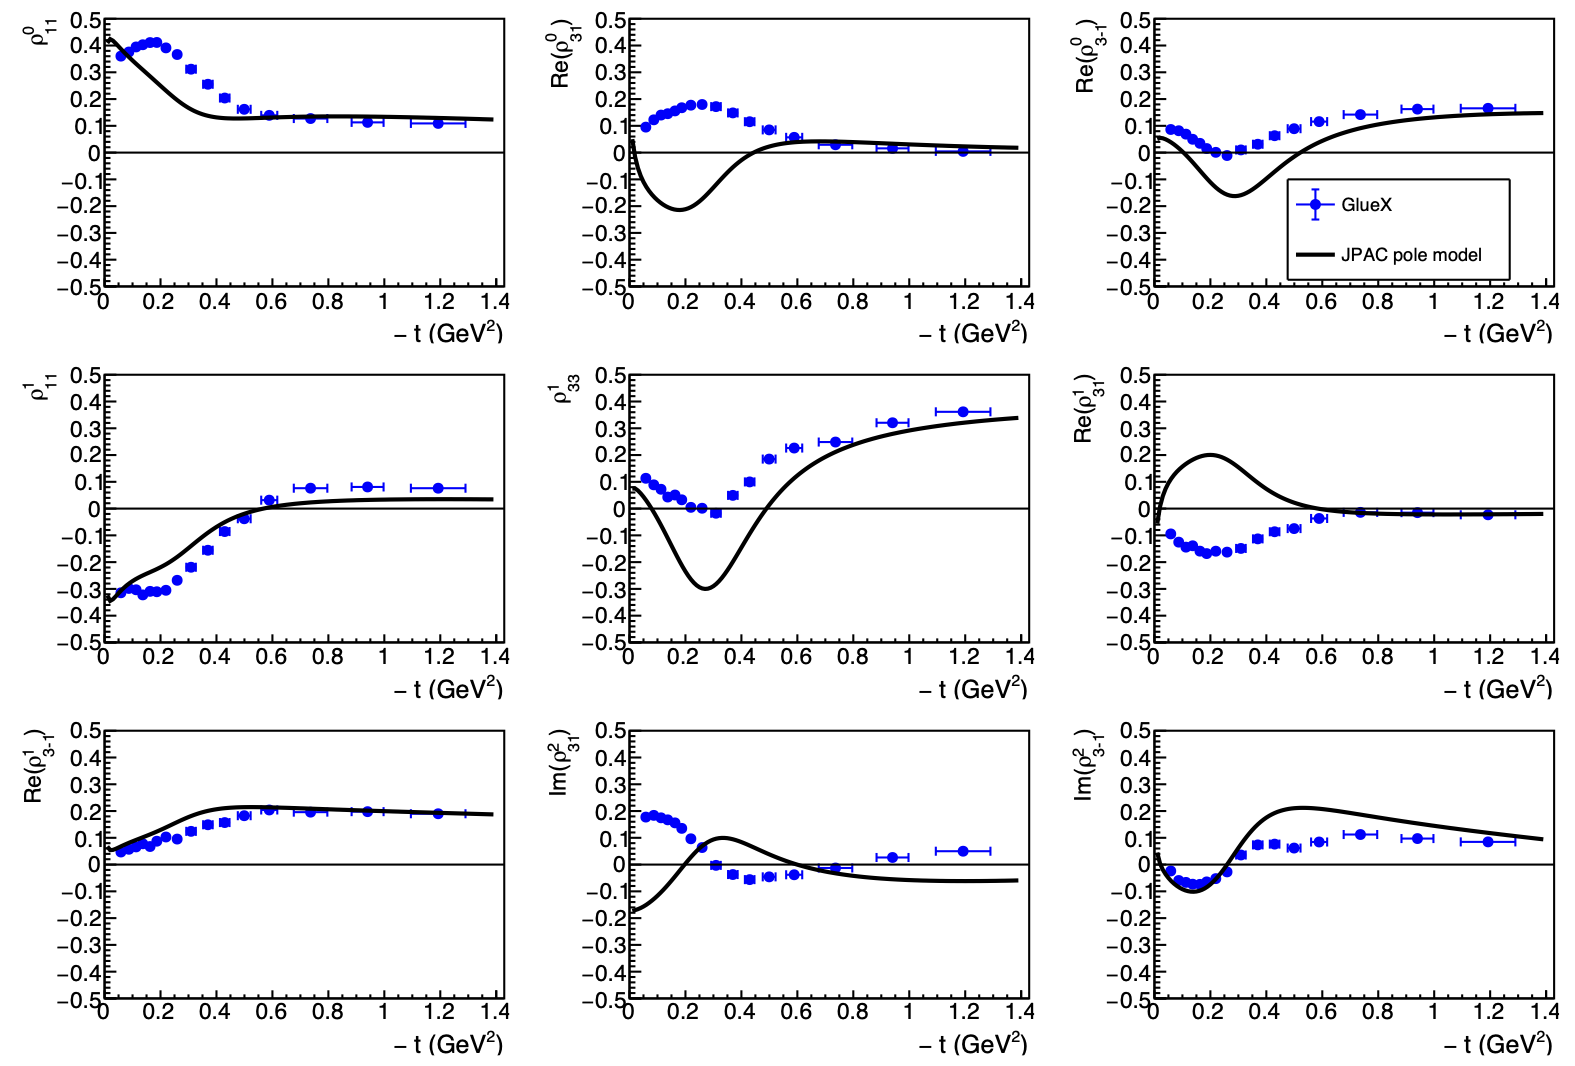
Figure 3a:
Spin-density matrix elements of $\Delta^{++}(1232)$ in the Gottfried-Jackson frame as a function of the momentum transfer squared $-t$ from the beam photon to the $\pi^-$. The vertical error bars consist of the statistical and systematic uncertainties added in quadrature. Our data (blue circles) are compared to the previous Ballam et al. measurement (green squares) [10] and to predictions of the JPAC pole model (solid black line) [5] and the Yu and Kong model (dashed red line) [6]. |
Phys.Lett.B 863 (2025) 139368: downloads png pdf |
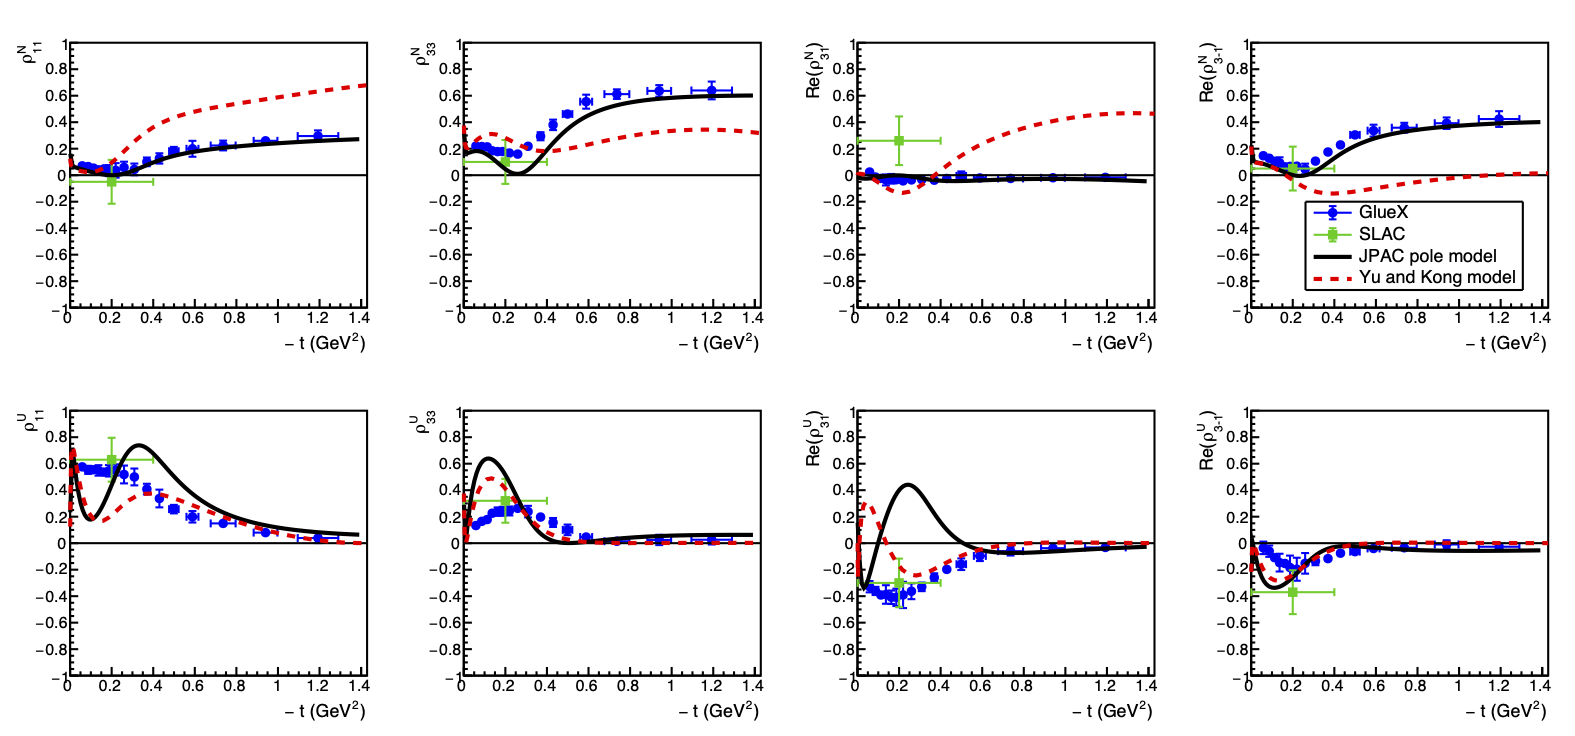
Figure 4a:
Linear combinations of SDMEs (see Eq. 15) that represent natural (N, top row) and unnatural (U, bottom row) exchange components. Our data (blue circles) are compared to the previous Ballam et al. measurement (green squares) [10] and to predictions of the JPAC pole model (solid black line) [5] and the Yu and Kong model (dashed red line) [6]. |
Phys.Lett.B 863 (2025) 139368: downloads png pdf |
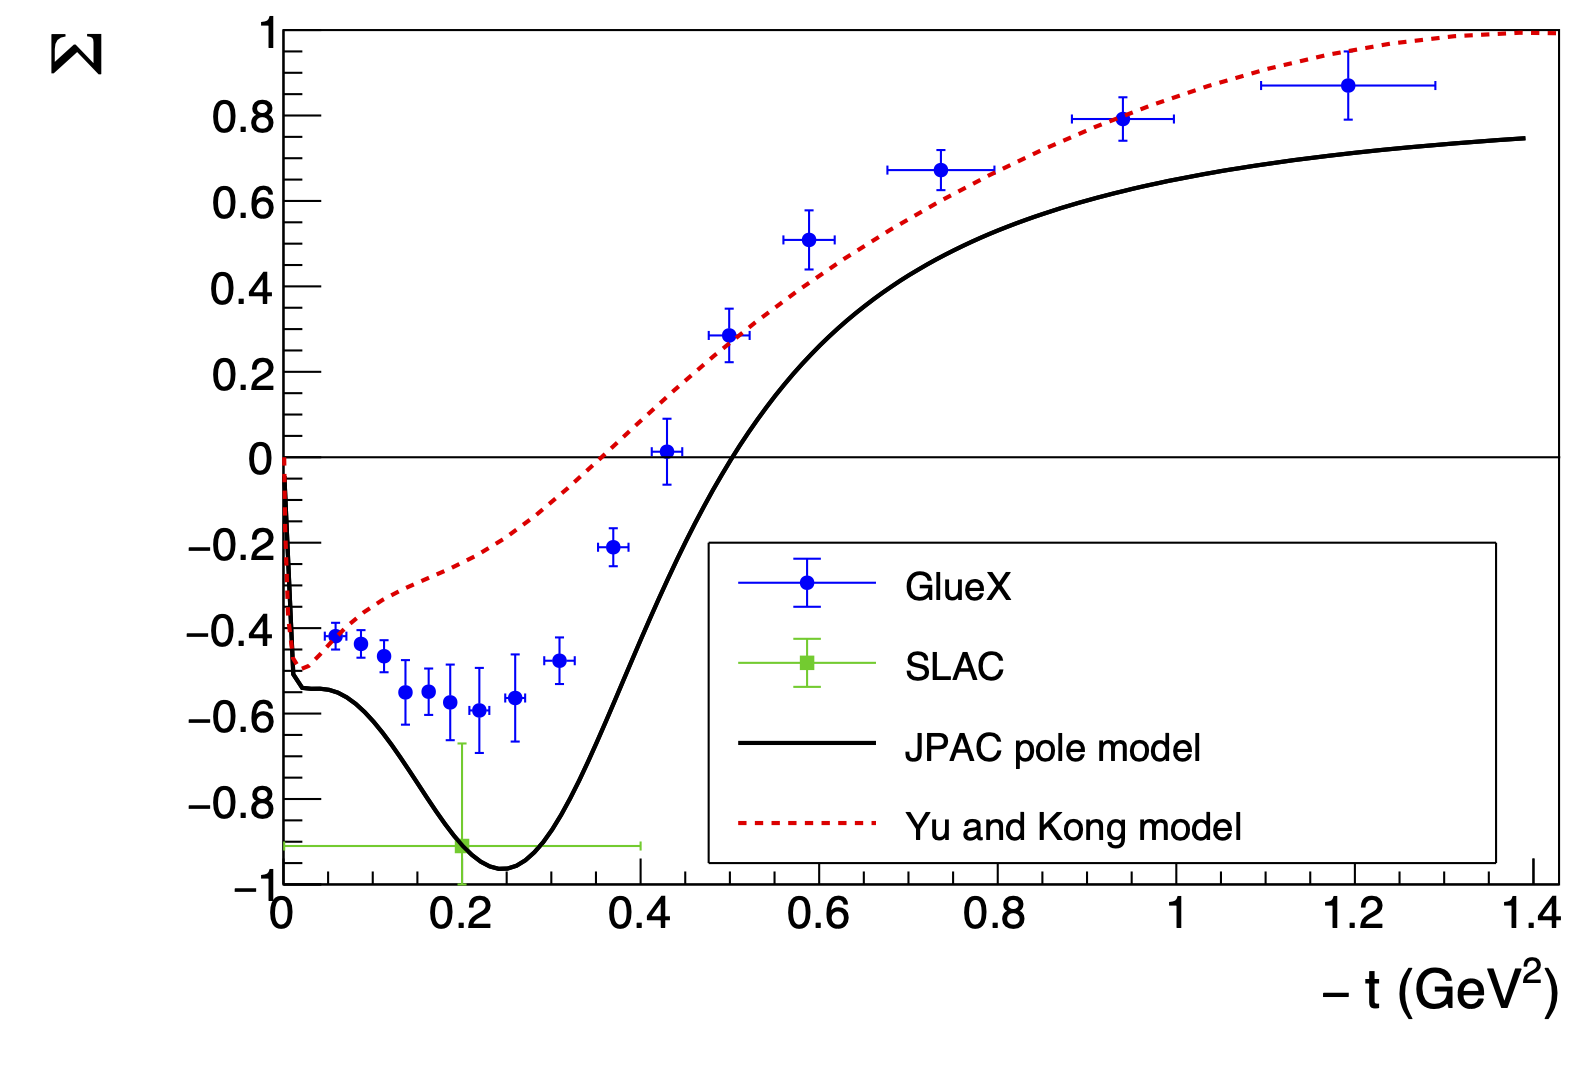
Figure 5a:
Beam asymmetry extracted from the SDMEs using Eq. 16 (blue circles). The GlueX data are compared to the previous Ballam et al. data (green squares) [10] and to predictions of the JPAC pole model (solid black line) [5] and the Yu and Kong model (dashed red line) [6]. |
Phys.Lett.B 863 (2025) 139368: downloads png pdf |
Figure 6a:
Spin-density matrix elements of $\Delta^{++}(1232)$ in the helicity frame. They are shown as a function of the momentum transfer squared $-t$ from the incoming photon to the $\pi^-$. The vertical error bars consist of only the statistical uncertainties. Our data (blue circles) are compared to predictions of the JPAC pole model (solid black line) [5]. |
Phys.Lett.B 863 (2025) 139368: downloads png pdf |
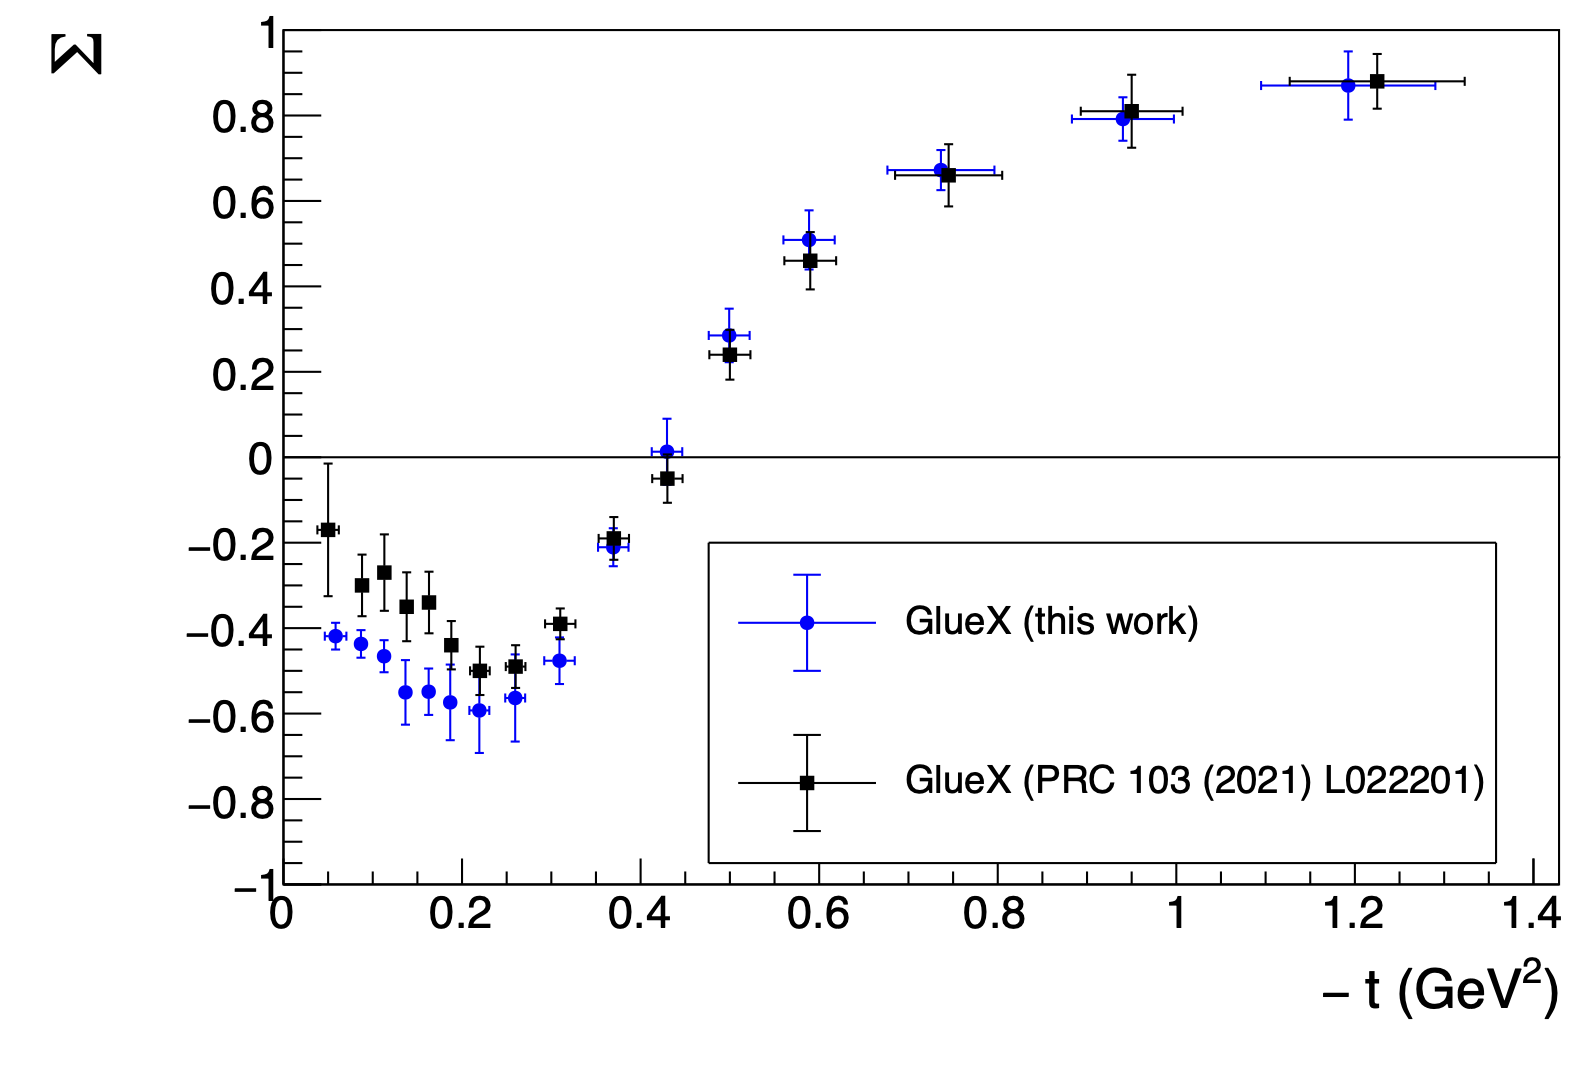
Figure 7a:
Beam asymmetry extracted from the SDMEs using Eq. 16 (blue circles), and our previously published results based on the yield-asymmetry method (black circles) [9]. Note, The latter data points are shown at the $t$-bin centers, while for the present results the mean value of the $t$ distribution for each $t$-bin is used. |